
From Excel Spreadsheets to Strategic Intelligence with Microsoft Fabric
The client was running a flagship Visitor Economy Performance model entirely in Excel. The model brought together multiple government and industry data sources, required hours of manual data entry each month, and produced static reports that were already outdated by the time stakeholders received them.
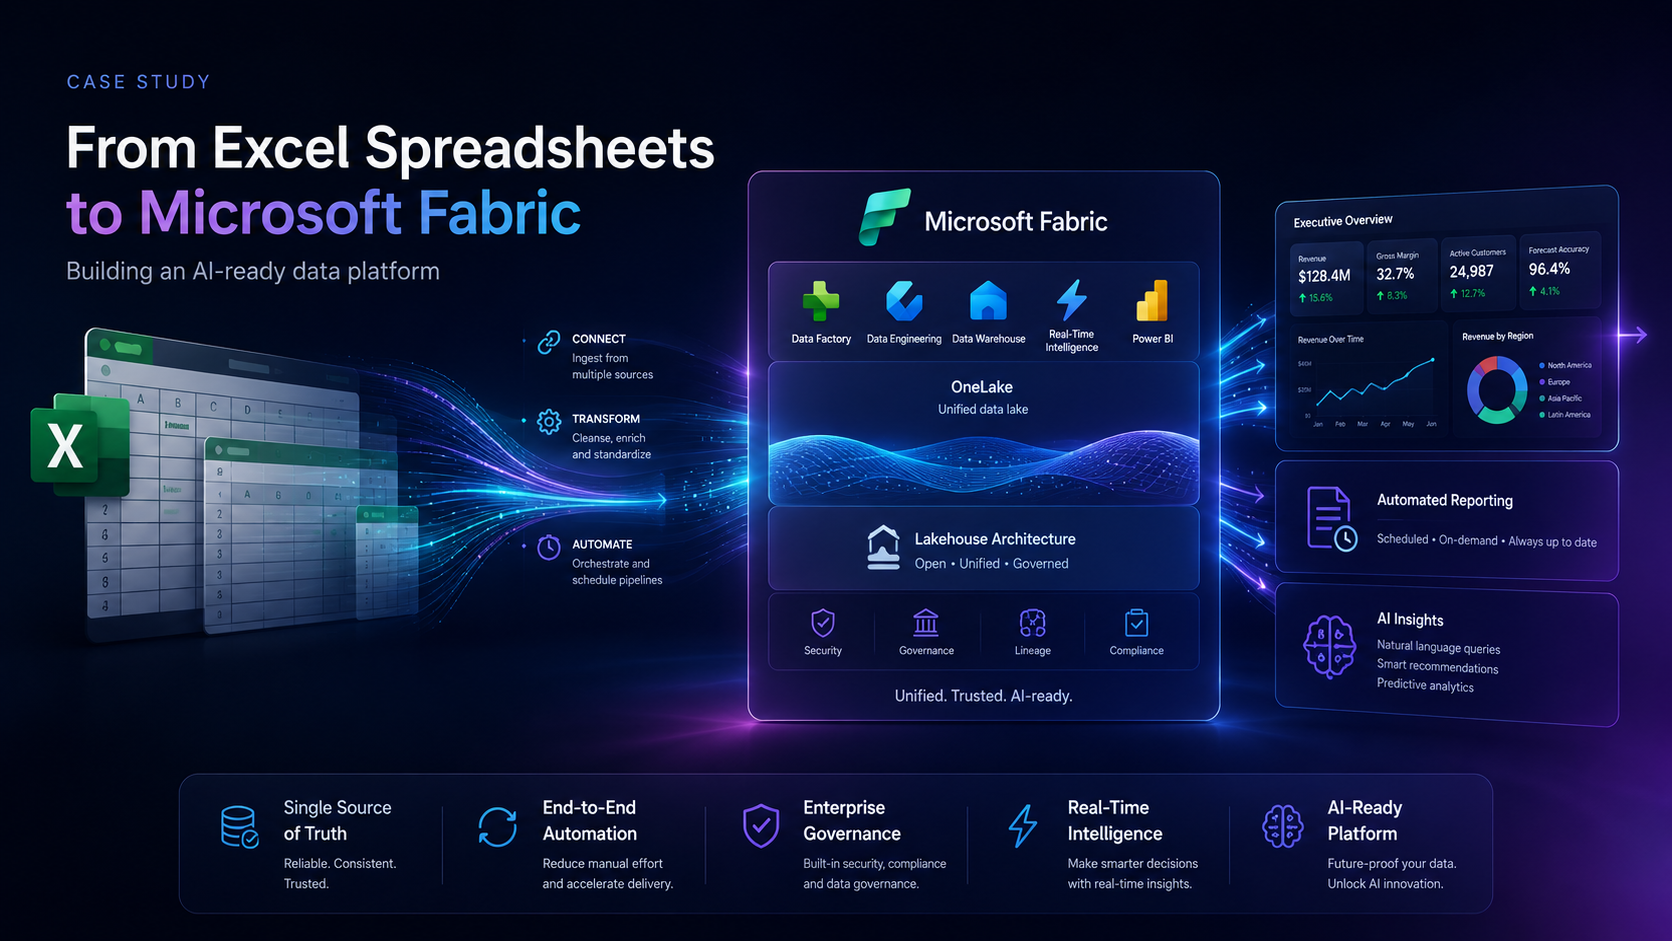
Cloudbliss began by mapping the existing analytics process end to end: source data, refresh frequency, transformation logic, stakeholder outputs, calculations, and decision points. This became the basis for the target Microsoft Fabric architecture.
Automated data pipelines were built to pull data from source systems into Fabric on a scheduled basis. Dataflows handled cleansing, transformation, and enrichment, removing the need for manual downloading, reformatting, and copy-pasting.
Power BI dashboards were then created to replace static spreadsheet outputs. These dashboards were interactive, automatically refreshed, and embedded on the client’s public website so stakeholders could explore the data directly.
A governance layer was added through Purview sensitivity labels, workspace access controls, and Sentinel monitoring. With clean, governed data flowing through Fabric, the client is now positioned to add Copilot for Power BI, natural language querying, and predictive forecasting.
Results
- Critical Excel analytics model migrated to Microsoft Fabric
- Project delivered over 16 weeks
- Manual data entry eliminated
- Automated data pipelines introduced
- Power BI dashboards embedded on the public website
- Reports moved from static outputs to real-time interactive analytics
- Data quality improved by reducing manual errors
- Purview sensitivity labels applied to protect underlying data
- Sentinel used to monitor access patterns
- Platform prepared for Copilot and predictive forecasting